📊 rbda-hadoop-hive-yelp
This is the final project for 🎓 NYU Realtime and Big Data Analytics course.
Check out details in Report
Description
In this project, we analyzed the restaurant rating and review datasets on Yelp to provide insights into the success patterns of popular restaurants in the US. We utilized Hadoop for data cleaning and Hive for analyzing Yelp reviews of successful US restaurants. By integrating this with US demographic data, we can gain a comprehensive understanding of the factors that contribute to a restaurant’s success.
Tools I Used
- Java
- Hadoop
- Hive
- Google Cloud console
- Tableau
- Visual Studio
Analysis
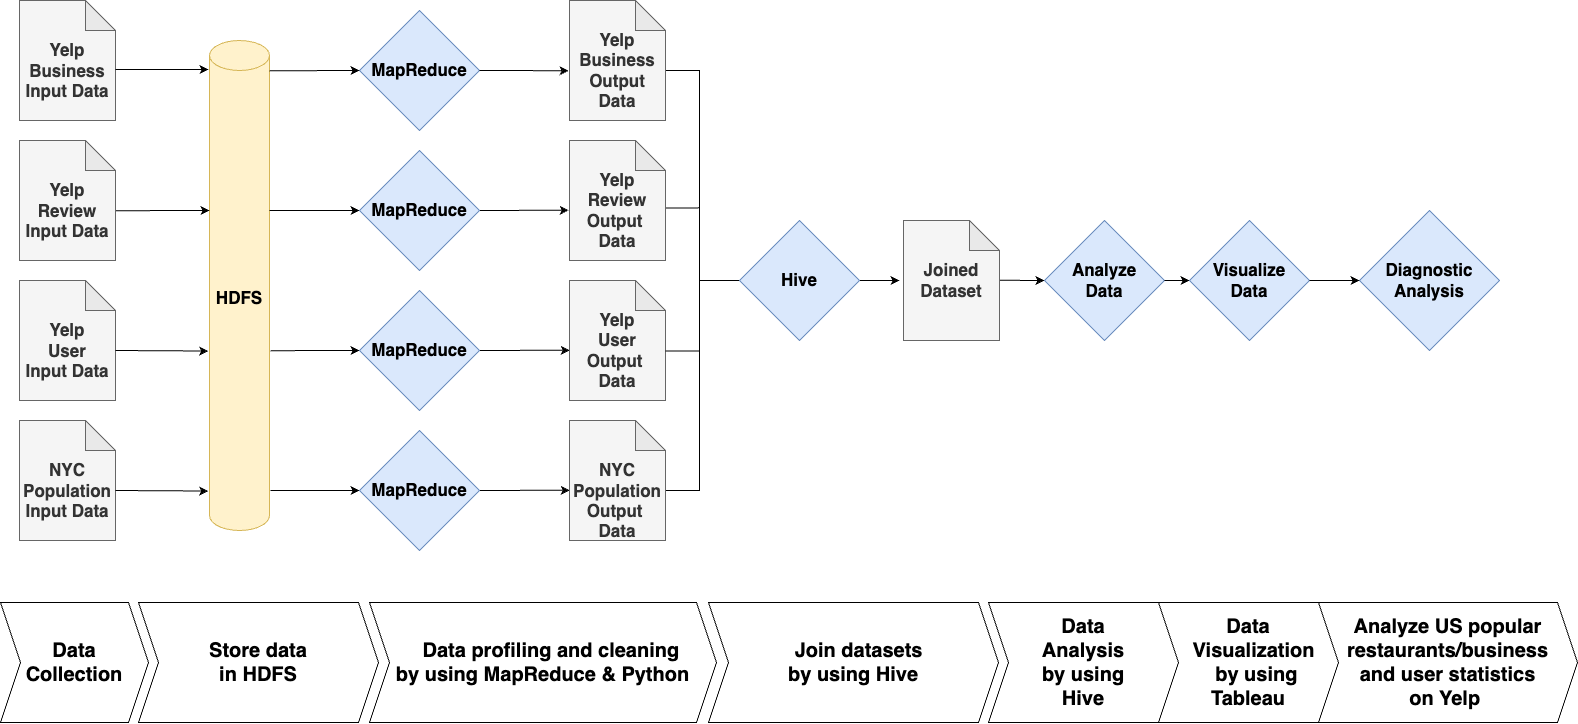
Analysis Diagram

Data Analysis
After data cleaning and profiling, we joined the datasets and analyzed the joined table by using Hive on HDFS. Firstly, we joined the Business, Review and User datasets by using business_id and user_id as foreign keys, then performed analysis to provide insights into the success patterns of popular restaurants in the US and user behavior on Yelp.
In the analysis of Businesses, we select users with an average star rating higher than 3 as ‘good_users’, and use their ratings to evaluate a business to ensure the quality of reviews. We first select the top 10 restaurants with highest average ranking and review count by good users, and then select top 10 Businesses with Highest Review Variability by ‘Good’ Users to show the businesses of different categories that have highly polarized reviews; We also selected top 10 businesses with the first category with highest review count and highest average rating to see the most popular and best rating businesses in different business types.
In the analysis of user behavior, we have computed user average review count, average user rating, and Number of Yelp users added per year from the joined table.
Data Visualization
After analyzing data on Hadoop, we visualized the result by using Tableau to transform the results into compelling and engaging visualizations.
a. Top 10 restaurants by good users

b. Top 10 restaurants by good users with business categories and state information

c. Geographical distribution of reviews in the U.S.

d. Number of Yelp users added per year

Insights
In the analysis of popular restaurants on Yelp, we can see that the most popular restaurants with the highest rating by good users are mostly in state CA, NV, MO, TN, PA and AZ, and different states show their preference on different kinds of cuisine, for example, we observe that in CA, popular restaurants are bars or catering while in PA, popular restaurants are Mediterranean food, and in FL, popular restaurants are foods like salad, bakery and poke. These preferences could have comprehensive analysis with population, lifestyle and weather dataset with corresponding states.
In the analysis of Businesses, we can see that the most popular businesses with the highest reviews count and the best businesses with highest average rating are highly identical. Which means that popularity and service quality are highly positively correlated, so a company can attract more customers by improving the quality of its food and service.
By analyzing the number of reviews and average ratings for all types of business, we found that the top three most popular types of business are Local Services, Food Trucks and Laundry Services, So if there are users who want to start a business, they can consider choosing these areas and will have a greater chance of success.
We also analyzed the variance of business rating. This analysis allowed us to know which companies’ scores are highly polarized, and these companies can look deeper into the causes of this phenomenon and make improvements.
In the analysis of user behavior, we found that Yelp’s highest number of new users was from 2011 to 2015, after which it showed a year-on-year decline, suggesting that Yelp could address this decline in new users by making improvements, such as developing new features or new incentives to attract more users.
